

Share Article:
Fundraising metrics help you track your performance over time, so you can understand whether your marketing strategies, fundraising efforts, and programs are effective or not. Together with more big-picture nonprofit Key Performance Indicators (KPIs), tracking your metrics gives you concrete data that you can use to inform your strategies going forward.
What are fundraising metrics?
Fundraising metrics allow you to measure the performance and success of your various activities, initiatives, and programs. Collecting data for these fundraising metrics helps you understand what’s working and what isn’t, so you can make more strategic decisions.
Nonprofit fundraising KPIs vs. metrics
Many people use KPIs and metrics interchangeably, but others describe them slightly differently.
For some nonprofits, KPIs are the high-level indicators that capture how successful you are against your major goals, like return on investment (ROI) or donor engagement rates. Metrics are the smaller data points below that measure specific activities, like the recurring gift percentage or social media engagement rates.
Why nonprofit fundraising metrics are important
Actively tracking nonprofit fundraising KPIs and metrics means you’re always collecting valuable data about your work, but the impact goes far beyond this.
Tracking fundraising KPIs and metrics enables you to:
- Understand how donors and supporters engage with your nonprofit organization
- Create more reliable prospect profiles
- Share detailed information with your leadership team and board
- Make data-backed decisions
- Adjust your strategy or plans based on real insights
- Demonstrate your overall fundraising success to donors, potential partners, and your community
- Be more transparent with your stakeholders
All the data you hold equals more clarity, more insights, and more evidence of the progress you’re making towards your goals.
40 Nonprofit fundraising metrics you should know
Monitoring fundraising metrics is essential if you want to determine your success, but which should you choose? Here are some of the main nonprofit fundraising metrics and KPIs to be aware of, how to calculate them, and what they show you.
You don’t have to track all of these all the time — choose the KPIs and metrics that are most meaningful for you now and over time.
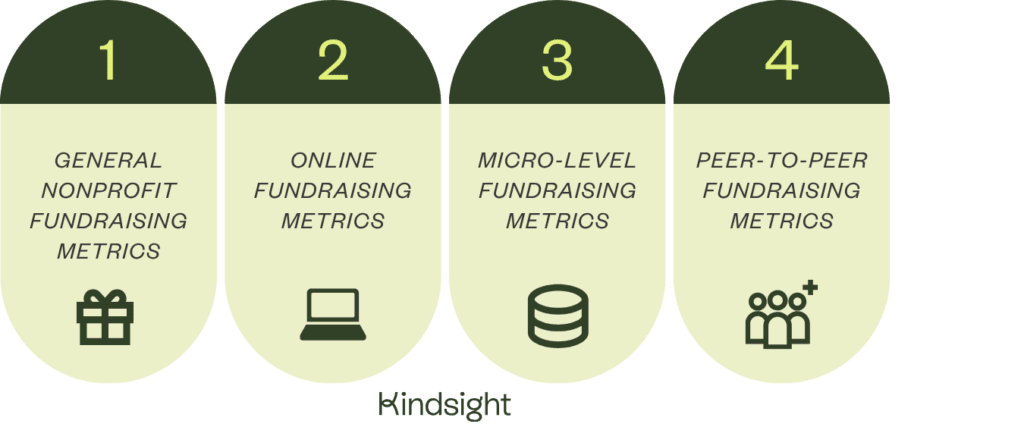
General nonprofit fundraising metrics
Understand what it costs to attract and keep donors, the cost per dollar raised, your overall fundraising return on investment, and more.
| Fundraising metric | What it means | How to calculate | How to use |
| Donor acquisition rate | How many new donors you gained over a certain period of time | (New donors ÷ total donors) x 100 | Evaluate current marketing efforts and decide which changes to make to improve your donor acquisition success |
| Donor acquisition cost (DAC) | How much it costs for you to acquire a new donor | Total acquisition costs ÷ number of new donors | Use to inform marketing activities and whether to switch to focusing on retention (to avoid high DACs) |
| Donor lifetime value (DLV) | Total projected revenue from a donor over their relationship with you | Average gift amount x frequency of gifts x lifespan | Estimate how much you’ll receive from a donor and how much to spend on future donor acquisition |
| Donor retention rate (also known as donor renewal rate) | How many new donors you keep (retain) from one year to the next | (Repeat donors ÷ total donors in previous year) x 100 | Understand whether retention strategies are working and influence future initiatives |
| Major donor retention rate | How many major donors you retained from one year to the next | (Repeat major donors ÷ total major donors in previous year) x 100 | Understand the differences in regular vs. major donor retention |
| Donor growth rate | Change in donors from one year to the next | (Last year’s total donors ÷ this year’s total donors) x 100 | Learn whether your supporter base is growing or shrinking, and how you can plan to increase growth rates next year |
| Lapsed donor reactivation rate | How many lapsed donors you manage to successfully convert to active donors | (Number of reactivated donors ÷ total number of lapsed donors) x 100 | Decide whether existing fundraising strategies are working or not |
| Donation revenue | How much revenue you made from donations | Total revenue – Total non-donation revenue | Evidence need, demonstrate success, and compare against previous years |
| Non-donation revenue | How much revenue you received that didn’t come from donations | Total revenue – Total donation revenue | Understand what ratio of your funds comes from donations vs. other sources, e.g. grants |
| Recurring gift percentage | Percentage of donations that are recurring vs. one-off | (Total revenue from recurring gifts ÷ total fundraising revenue) x 100 | Decide whether to focus your strategy on one-off or recurring donations |
| Cost per dollar raised | How much it costs you in resources to receive $1 worth of donations | Total fundraising expenses ÷ Total revenue | Determine how efficient your fundraising strategy is |
| Average gift size or average donation size | The average value of donations made to your organization | Total donation amount ÷ Number of donors | Consider how you can adjust your strategies to attract larger donations |
| Gift upgrade rate | How many recurring donors increased the dollar rate of their donation this year | (Number of donors who gave more than last year ÷ Total number of retained donors) x 100 | Understand how effective your upgrade suggestion messaging is |
| Time to “thank you” | How long it takes you on average to send a thank you message to donors | Total response time for all donors ÷ Number of donors responded to | Calculate whether your response time meets what’s expected (within 48 hours) and plan improvements if it doesn’t |
| Moves per donor | How many strategic touchpoints or actions you need to move a donor through the pipeline | Total qualified moves logged ÷ Total unique donors engaged | Understand how many moves are actually required in reality, so you can introduce efficiencies |
| Stage conversion rate | Percentage of donors moving from one stage of the donor journey to the next | (Number of people who took action ÷ Number of people who had the opportunity to take action) x 100 | Learn whether your workflows and interactions work, or whether you need to make them more effective |
| Event conversion rate | How many event attendees took the desired action—for example make a donation | (Number of conversions ÷ Total number of event attendees) x 100 | Understand whether an event was effective in meeting its goal or not |
| Time in each stage | How long donors spend in each stage of the donor journey, on average | Exit date – Entry date ÷ Total donors in stage | Inform your strategy for successfully moving donors further down the pipeline |
| Fundraising efficiency ratio | How much an organization spends to generate donations | Total fundraising expenses ÷ Total revenue | Decide how effective your current fundraising strategy is and compare your fundraising efficiency ratio against previous years |
| Gift asks made | Percentage of requests for gifts made to donors over a period of time | Number of requests made ÷ Number of potential prospects to contact | Understand whether the impact of how many asks you currently make is positively or negatively impacting donations |
| Gifts secured | Percentage of gifts secured from donors over a period of time | Number of donations ÷ Number of prospects contacted | Determine whether your current outreach strategy results in enough donations or not |
| Matching gift rate | Percentage of eligible donations successfully matched by employers | Total matching gift funds received ÷ Total eligible donations | Understand whether donors are taking advantage of gift matching options and whether you need to promote them better |
| Pledge fulfillment percentage (PFP) | Percentage of pledges that actually turn into donations | Amount fulfilled ÷ Total amount pledged | Evaluate whether the strategy you use for collecting pledges works or not |
| Fundraising return on investment (ROI) | How effective your fundraising campaigns are at generating revenue | (Net revenue ÷ Total costs) x 100 | Compare progress against previous years |
| Donor satisfaction score | How happy your donors are with your organization | (Number of satisfied donors ÷ Total number of responses) x 100 | Compare over time to identify trends in perception |
| Fundraising participation rate | Percentage of supporters who donated during a campaign | (Number of donors ÷ Total number of prospects) x 100 | Understand how many of your donors actually give |
Online fundraising metrics
Websites, email campaigns, and social media activities can all be measured and tracked using these online fundraising metrics.
| Fundraising metric | What it means | How to calculate | How to use |
| Website page views | How many pageviews your website receives over a certain period | Number of times a user loads a page on your website | Compare over time to learn whether marketing strategies are effective or not |
| Landing page conversion rates | Percentage of people that take a desired action on your landing page | (Number of conversions ÷ Total visitors) x 100 | Decide whether landing page copy and call to action is working or if it needs to be adjusted |
| Email open rates | How many people opened your emails | (Number of emails opened ÷ Total number of emails sent) x 100 | Compare over time to decide whether campaigns are working or not |
| Email click-through rates | How many people clicked a link within your emails | (Number of email links clicked ÷ Total number of emails sent) x 100 | Compare over time to understand what donors are motivated to engage with |
| Social media engagement rates | How many donors engaged with your content on social media | (Total engagements ÷ Total reach) x 100 | Understand what your donors are interested in engaging with |
Micro-level fundraising metrics
Sometimes you want a more zoomed-in view of what’s happening within a specific project. These metrics can help you understand the impact of an event, activity, or program.
| Fundraising metric | What it means | How to calculate | How to use |
| Campaign-specific response rates | How many people responded to your campaign messages, e.g. emails or direct mail | (Number of responses received ÷ Number of campaign messages sent) x 100 | Evaluate against other campaigns to understand why they’re more or less popular than others |
| Invitation response rates | Percentage of people who responded to your invitations | (Number of invitation responses received ÷ Total number sent) x 100 | Understand how you can make your invitations more engaging to improve response rates |
| Event attendance | How many people showed up to an event compared to how many registered | (Number of event attendees ÷ Number of event attendees registered) x 100 | Learn how you can better convert signups into event attendees |
| Geographic or demographic trends | How your donors in different geographic or demographic groups are interacting with your organization | Actions taken by specific geographic or demographic groups, as collected by your fundraising CRM | Understand how different groups engage with your content, make donations, or respond to campaigns |
Peer-to-peer fundraising metrics
Peer-to-peer (P2P) fundraising campaigns generate a lot of interest and attention, but these metrics will give you insights into how those pages actually performed.
| Fundraising metric | What it means | How to calculate | How to use |
| Fundraising goal vs actual dollars raised | Percentage of your fundraising target reached from donations | (Actual dollars raised ÷ Fundraising goal) x 100 | Analyze whether your goal was achievable or not, and how to encourage participants closer to your goal next time |
| Pages created vs pages actively raising money | Percentage of pages that raised donations compared to the total amount created for the P2P campaign | (Pages with donations made ÷ Total number of fundraising pages) x 100 | Understand how you can better motivate participants to generate donations from their page |
| Average dollar amount raised per page | How many dollars on average a P2P fundraising page raised | Total revenue raised ÷ Total number of active pages | Compare against other P2P campaigns to understand why some are more successful than others |
| Page-view-to-donation conversion | Percentage of page views that turned into donations | (Total donations ÷ Total page views) x 100 | Learn more about why pages are or aren’t converting |
| Gifts per day, in numbers and dollars | How many donations were made per day, on average | Total donation amount ÷ Number of days | Understand how many days it’s likely to take to reach your goal |
Fundraising metrics best practices
Gathering data is a good habit to build, but there’s more that goes into successful KPI and metric monitoring than the “set it and forget it” approach.
Lean on these fundraising metrics best practices to get more from your data.
- Decide which metrics you want to track: Choose a handful of major KPIs that you want to keep an eye on, then assign individual metrics depending on your current campaigns and goals.
- Train your team on how to set and review KPIs: Give your team members the tools and knowledge they need to be able to accurately measure your nonprofit’s fundraising success.
- Monitor changes in your metrics over time: Collect data on your chosen KPIs and metrics over a long-term period to better inform your strategy.
- Use software to make collecting and analysing data easier: Choose a fundraising CRM that connects your donor data and enables you to compare progress against your KPIs.
- Turn insights into action: Use your data to drive change by creating or changing strategies, developing business cases, or demonstrating your impact.
Once you’re clear on what your KPIs and key metrics are and how you plan to use them, consolidate all your plans in a simple strategy document that covers metrics and fundraising analytics.
Make smarter decisions with the right data
Fundraising metrics help you understand what’s working and what’s not, and where you can make improvements to make your activities more efficient, effective, or impactful.
Decide which KPIs and metrics to track, formalize them in a strategy, and build a habit around collecting, analyzing, and making more informed decisions with your donor data.
FAQs about nonprofit fundraising metrics
What are examples of KPIs in fundraising?
Popular Key Performance Indicators (KPIs) in fundraising include cost per dollar raised (CPDR), donor retention rate, donor acquisition cost (DAC), and lifetime donor value (DLV).
How can you track fundraising metrics?
Fundraising tools can help you collect and analyze data, then track changes over time either from a dashboard or by generating monthly or yearly reports. You can also track fundraising metrics manually, but this is much more time-intensive and complicated.
How are fundraisers evaluated?
Fundraisers are typically evaluated against a number of metrics, including fundraising event return on investment (ROI), average gift size, conversion rate, and number of attendees.
How can I measure how effective a fundraising campaign was?
Reflect on your overall goal for the campaign, then collect data that helps you understand whether you met it or not. Evaluate the number of donations raised, average gift size, social media engagement, email open rates, and other relevant metrics to get a full picture of the impact of your fundraising appeal.
How can I prove that an email campaign was effective?
Compare email open rates and email link click rates to other campaigns you’ve run to see whether it was more or less effective than others. Calculate how many readers took action after receiving an email, and how many of those actions resulted in positive donor engagements like donations, recurring gift signups, donor re-engagement, or new donor recommendations.

Be the first to read our resources.
The world is changing quickly—and our resources help you stay on top of it all. Sign up to get new insights, success stories, and more, sent right to your inbox.
Explore related resources.
-
Nonprofit board governance: Roles, responsibilities, and best practices

Post Nonprofit board governance: Roles, responsibilities, and best practices
Learn the core pillars of nonprofit board governance. Discover essential roles, legal responsibilities, and best practices to maximize your mission's impact.
-
How to use nonprofit data visualization to tell your story

Post How to use nonprofit data visualization to tell your story
Learn best practices in nonprofit data visualization to transform complex data into an engaging, accessible story that rallies donor support.
-
Nonprofit email marketing: Strategy, tips, and real-life email examples

Post Nonprofit email marketing: Strategy, tips, and real-life email examples
Empower your mission with our nonprofit email marketing guide. Discover strategies, best practices, and real-life examples to boost donor engagement!